Journal articleFree to read
Stable isotopes in atmospheric precipitation of Tashkent city
Тошкент шаҳри атмосфера ёғинлари таркибидаги стабил изотоплар
- Hydrometeorological Research Institute, Tashkent, Uzbekistan
Highlights
- Monthly samples from the Tashkent Observatory station, 2022–2023, compared with data for 1971.
- δ²H from −122.73‰ (January 2022) to +16.41‰ (April 2022); δ¹⁸O from −16.34‰ to +1.95‰.
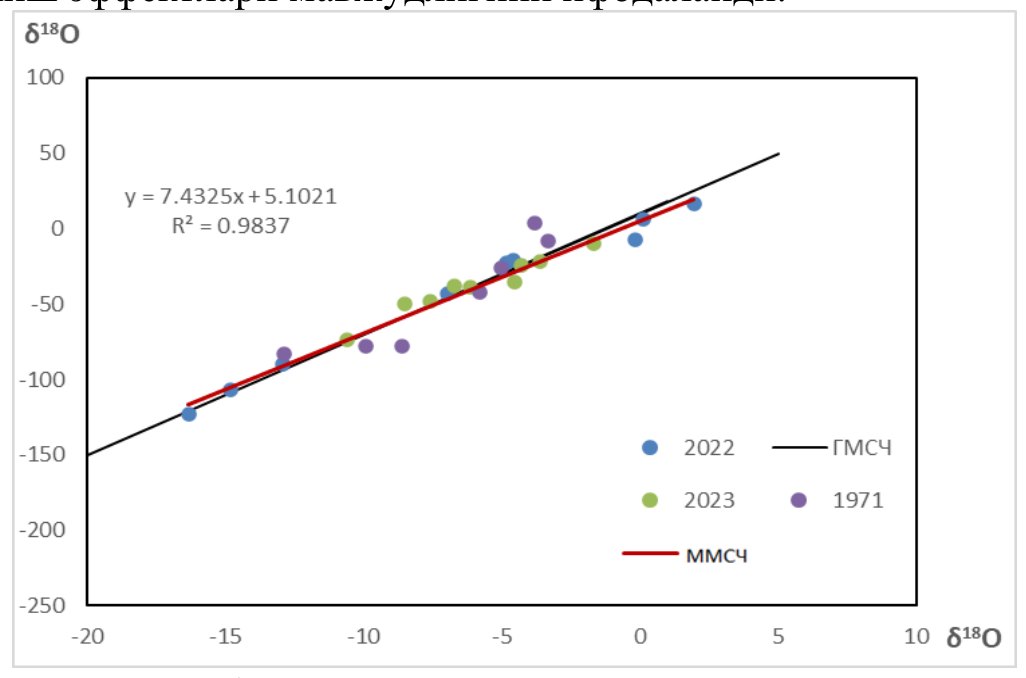
- Local meteoric water line: δ²H = 7.33 δ¹⁸O + 5.27; the trend line on Fig. 7 reads y = 7.4325x + 5.1021 (R² = 0.9837).
- Mean annual precipitation in Tashkent 423.4 mm: over 41% falls in spring, 36% in winter, 18% in autumn and 5% in summer.
Keywords
- precipitation
- stable isotopes
- isotope hydrology
- local meteoric water line
- deuterium
- δ²H
- oxygen-18
- δ¹⁸O
- Tashkent city
Summary
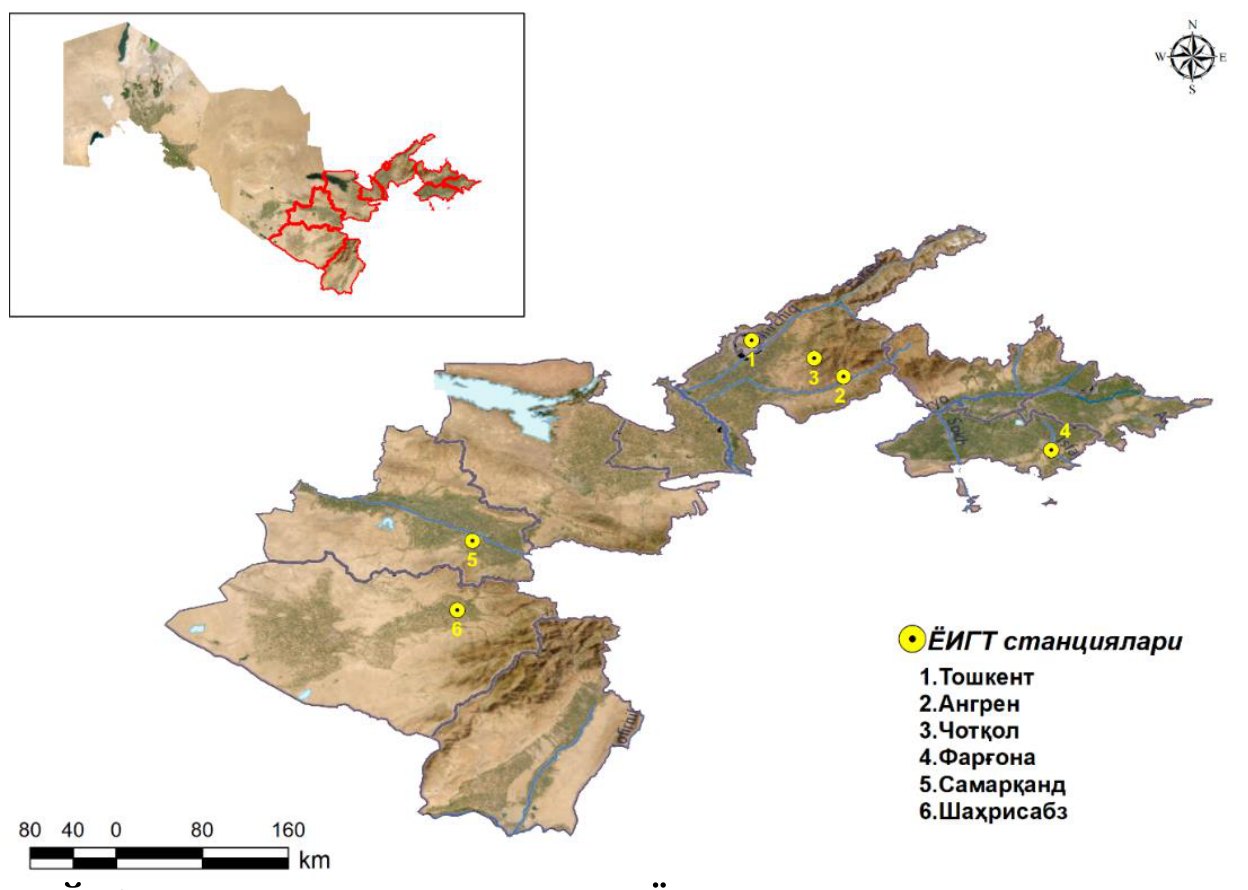
The authors collected monthly precipitation samples at the Tashkent Observatory weather station in 2022–2023. The 2022 samples were analysed at a laboratory of the Geological Survey of the Slovak Republic and the 2023 samples at the IAEA stable isotope laboratory, both by laser spectroscopy. A PALMEX RS-1C precipitation sampler installed at the station has collected monthly samples since October 2023; the station is one of six Uzbek weather stations added to the GNIP network of the IAEA and the WMO.
δ²H ranged from +16.41‰ to −122.73‰ and δ¹⁸O from +1.95‰ to −16.34‰. The lowest values were measured in January 2022 and the highest in April 2022; values are high in the warm season and low in the cold season, following air temperature.
From the 2022–2023 data together with the 1971 data, the authors derive a local meteoric water line of δ²H = 7.33 δ¹⁸O + 5.27. Its slope is lower than that of the global line, which they attribute to the arid climate and local evaporation. The trend line printed on Fig. 7 reads y = 7.4325x + 5.1021.
Figures (2)
How to cite
B. E. Nishonov, S. R. Isabekov, G. U. Umirzakov, L. A. Saidmakhmudova and M. N. Nurmatov (2024). Stable isotopes in atmospheric precipitation of Tashkent city. Gidrometeorologiya va atrof-muhit monitoringi (Hydrometeorology and Environmental Monitoring), 2024, No. 2, pp. 69–77. https://nigmi.uz/portfolio/hydrometeorology-and-environmental-monitoring-scientific-journal-%e2%84%96-2-2024-y/