Статья в журналеОткрытый доступ
Тепловой поток Узбекистана: геология и интерпретация
Heat flow of Uzbekistan: geology and interpretation
https://doi.org/10.33581/2521-6740-2020-1-95-105
Ключевые данные
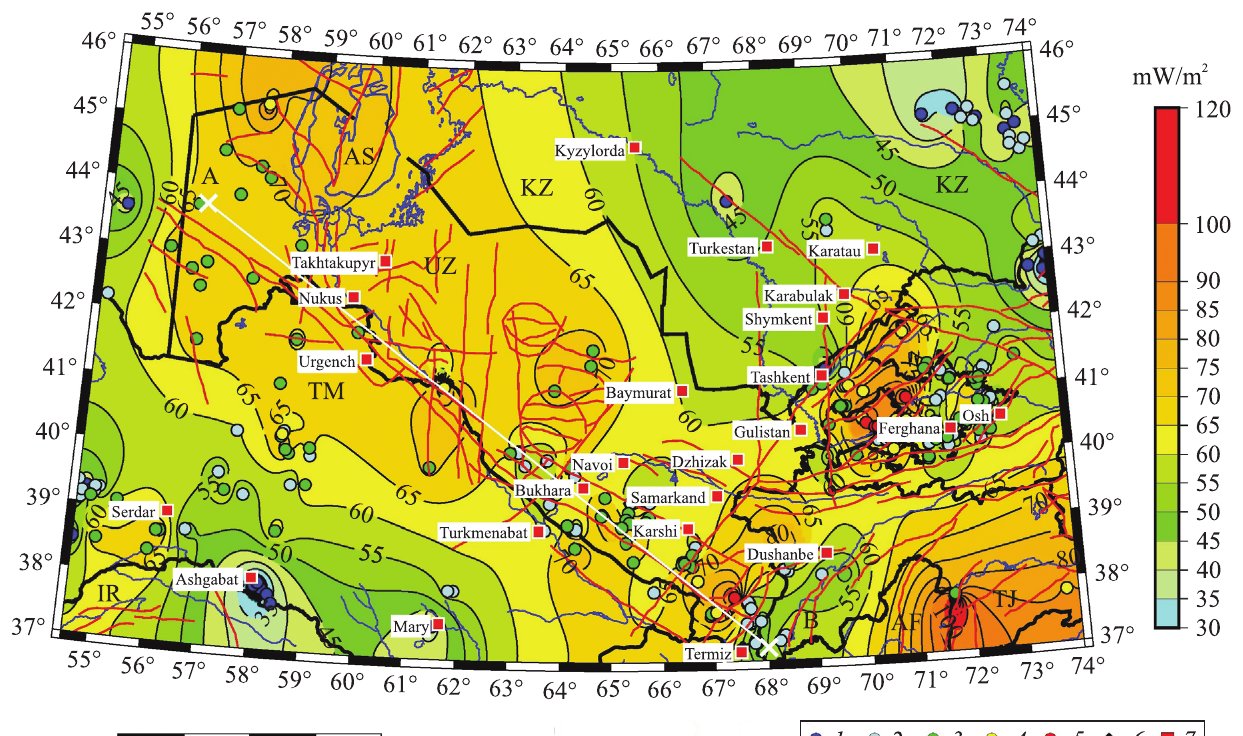
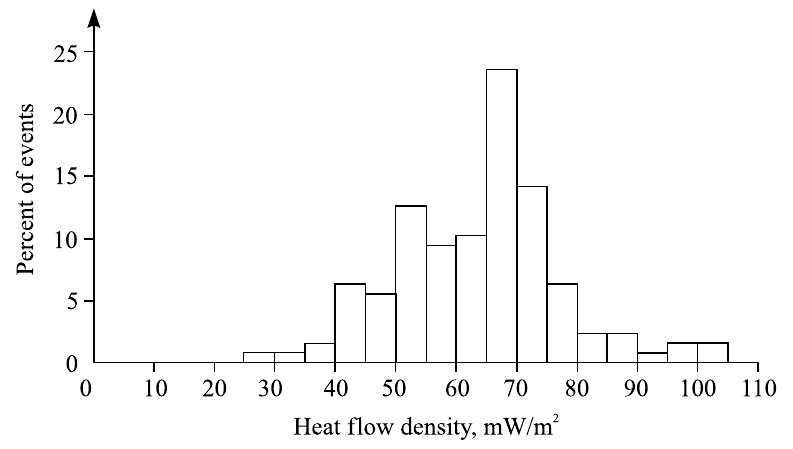
- Тепловой поток в Узбекистане меняется от 20–30 до примерно 100 мВт/м².
- По стране преобладают значения 45–80 мВт/м², чаще всего 60–70 мВт/м².
- На профиле через всю страну равнинная Туранская плита характеризуется довольно выдержанными значениями — около 60–70 мВт/м².
- Первые измерения теплового потока в Узбекистане выполнены в середине 1960-х годов.
Аннотация
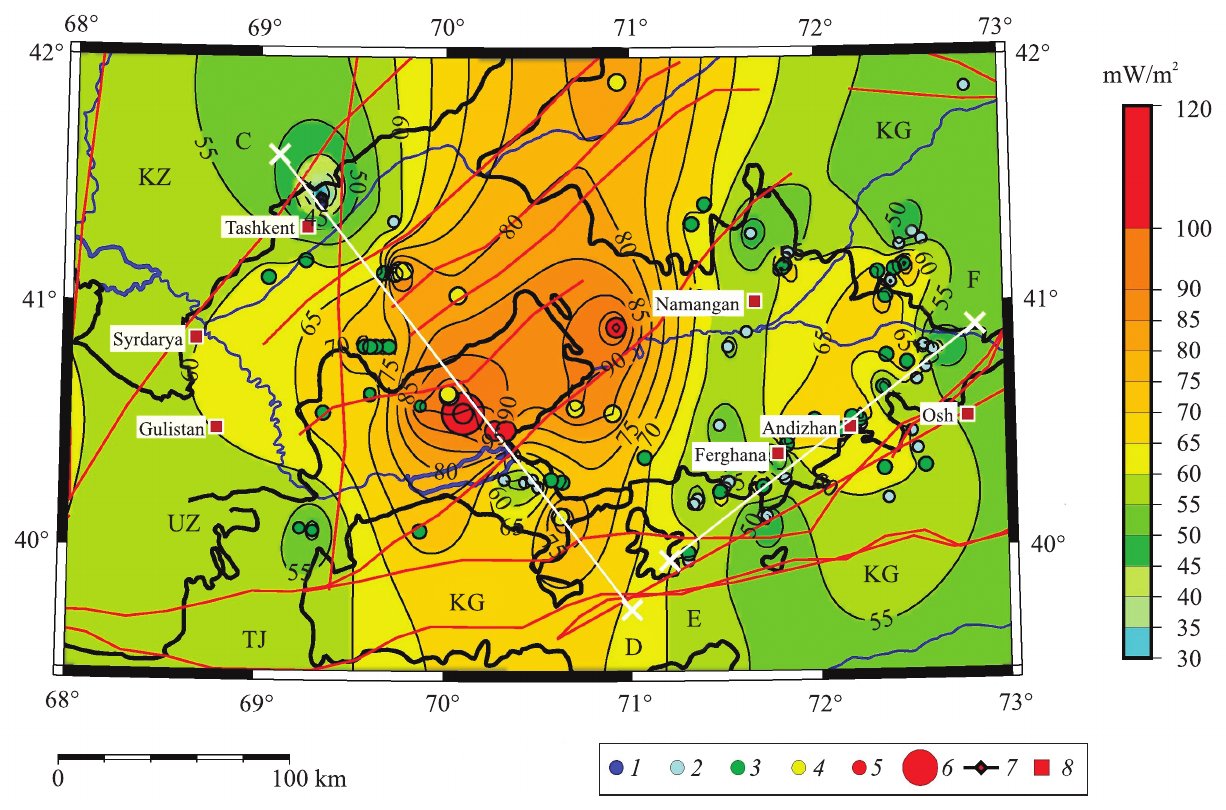
The first determinations of the heat flow density in Uzbekistan, as well as in Central Asia as a whole, were carried out in the middle 1960s. In subsequent years, many researchers, primarily in connection with the search and exploration of oil and natural gas deposits, studied the geothermal field of the region. The data accumulated to date show a significant heterogeneity of the thermal field in both Uzbekistan and the adjacent territory of Central Asia. Rare wells were studied in the desert areas of Kyzyl Kum and Kara Kum. The heat flow in Uzbekistan varies over a wide range from 20–30 to approximately 100 mW/m2. Its high values are characteristic of intermountain depressions and blocks of the earth’s crust with a dense network of deep faults. The heat flow increases significantly in the southern and eastern parts of Uzbekistan, as well as in the neighbouring territories adjacent to the mountain structures of the Tien Shan and Pamir, characterized by high seismicity, tectonic and thermal activation. An updated map of the heat flow density of Uzbekistan was compiled and, separately for the Fergana Depression. They reflect a significant regional variability of the geothermal field. With the transition from the relatively flat territory of the Turanian Plate to mountain structures, the degree of differentiation by the heat flow increases significantly. This is typical of the entire orogenic Alpine-Himalayan Belt.
Авторская аннотация воспроизводится на условиях лицензии CC BY-NC 4.0. Аннотация приводится на английском языке.
Простыми словами
Авторы составили обновленную карту плотности теплового потока Узбекистана и сопредельных территорий, а также отдельную, более детальную карту Ферганской впадины.
Тепловой поток выше в межгорных впадинах и в блоках земной коры с густой сетью глубинных разломов и возрастает на юге и востоке страны, вблизи горных сооружений Тянь-Шаня и Памира.
Рисунки (3)
Как цитировать
V. I. Zui, D. N. Andreyev and K. Kh. Rakhmatullayev (2020). Heat flow of Uzbekistan: geology and interpretation. Journal of the Belarusian State University. Geography and Geology, 1, 95–105. https://doi.org/10.33581/2521-6740-2020-1-95-105