Journal articleOpen access
Heat flow of Uzbekistan: geology and interpretation
https://doi.org/10.33581/2521-6740-2020-1-95-105
Highlights
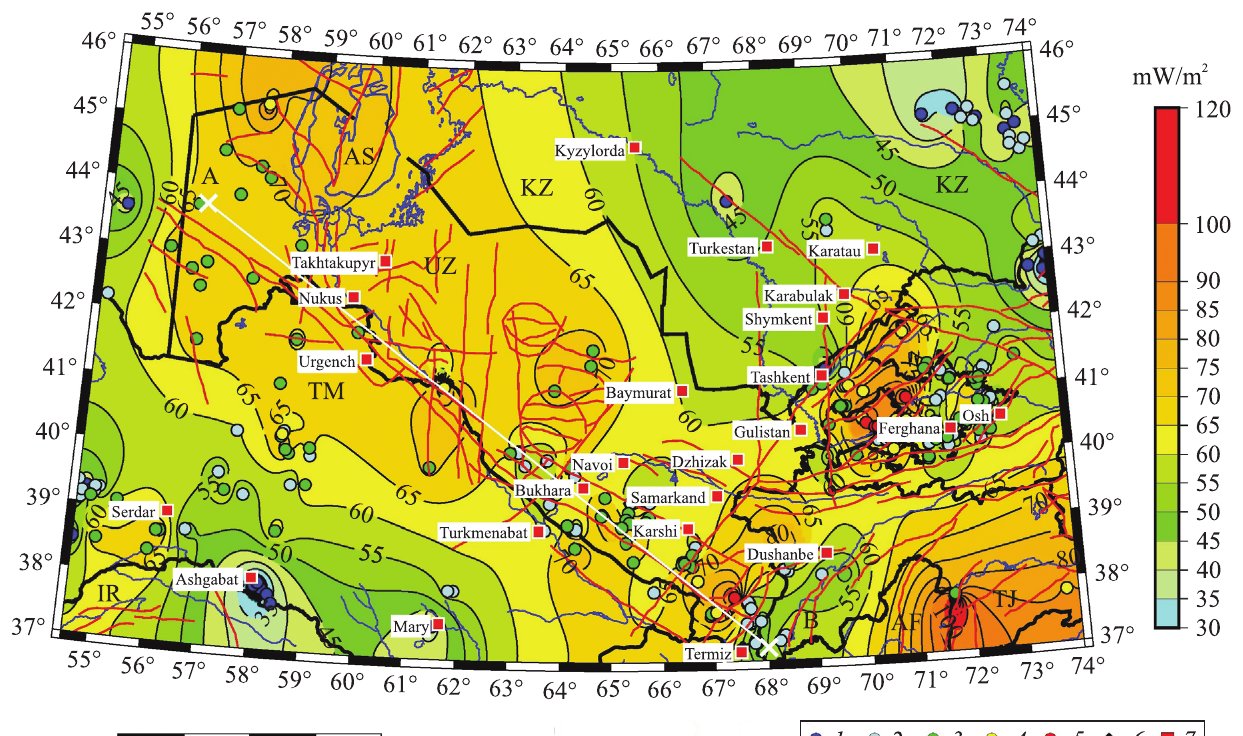
- Heat flow in Uzbekistan ranges from 20–30 to about 100 mW/m².
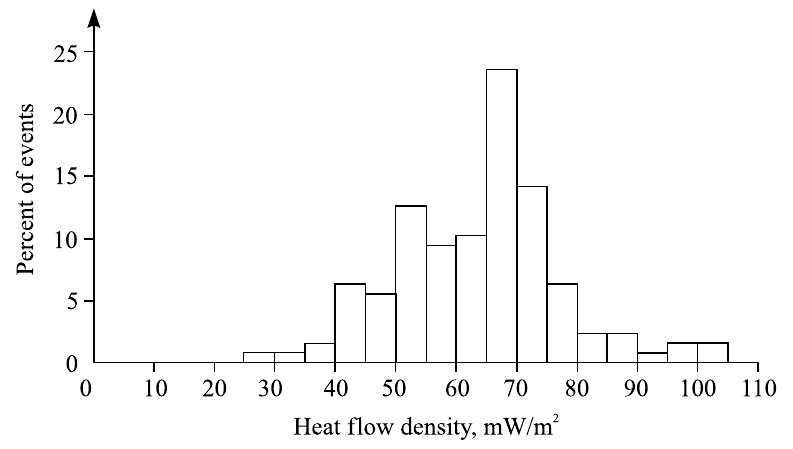
- Values of 45–80 mW/m² prevail across the country, most often 60–70 mW/m².
- Along a profile across the country, the flat Turanian Plate shows fairly even values of about 60–70 mW/m².
- The first heat flow measurements in Uzbekistan were made in the mid-1960s.
Abstract
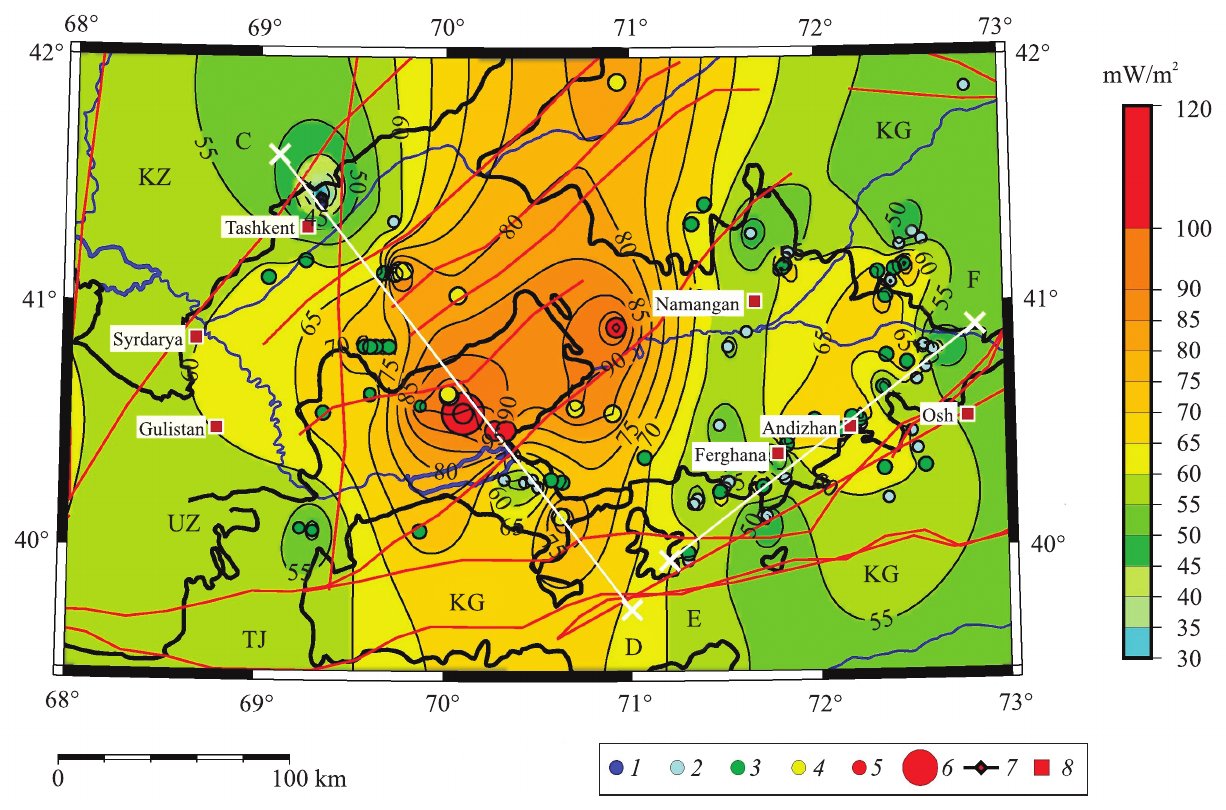
The first determinations of the heat flow density in Uzbekistan, as well as in Central Asia as a whole, were carried out in the middle 1960s. In subsequent years, many researchers, primarily in connection with the search and exploration of oil and natural gas deposits, studied the geothermal field of the region. The data accumulated to date show a significant heterogeneity of the thermal field in both Uzbekistan and the adjacent territory of Central Asia. Rare wells were studied in the desert areas of Kyzyl Kum and Kara Kum. The heat flow in Uzbekistan varies over a wide range from 20–30 to approximately 100 mW/m2. Its high values are characteristic of intermountain depressions and blocks of the earth’s crust with a dense network of deep faults. The heat flow increases significantly in the southern and eastern parts of Uzbekistan, as well as in the neighbouring territories adjacent to the mountain structures of the Tien Shan and Pamir, characterized by high seismicity, tectonic and thermal activation. An updated map of the heat flow density of Uzbekistan was compiled and, separately for the Fergana Depression. They reflect a significant regional variability of the geothermal field. With the transition from the relatively flat territory of the Turanian Plate to mountain structures, the degree of differentiation by the heat flow increases significantly. This is typical of the entire orogenic Alpine-Himalayan Belt.
The authors’ abstract, reproduced under CC BY-NC 4.0.
In plain English
The authors compile an updated map of heat flow density for Uzbekistan and neighbouring areas, and a separate, more detailed one for the Fergana Depression.
Heat flow is higher in intermountain depressions and in blocks of the crust cut by many deep faults, and rises in the south and east of the country, near the Tien Shan and Pamir mountains.
Figures (3)
How to cite
V. I. Zui, D. N. Andreyev and K. Kh. Rakhmatullayev (2020). Heat flow of Uzbekistan: geology and interpretation. Journal of the Belarusian State University. Geography and Geology, 1, 95–105. https://doi.org/10.33581/2521-6740-2020-1-95-105